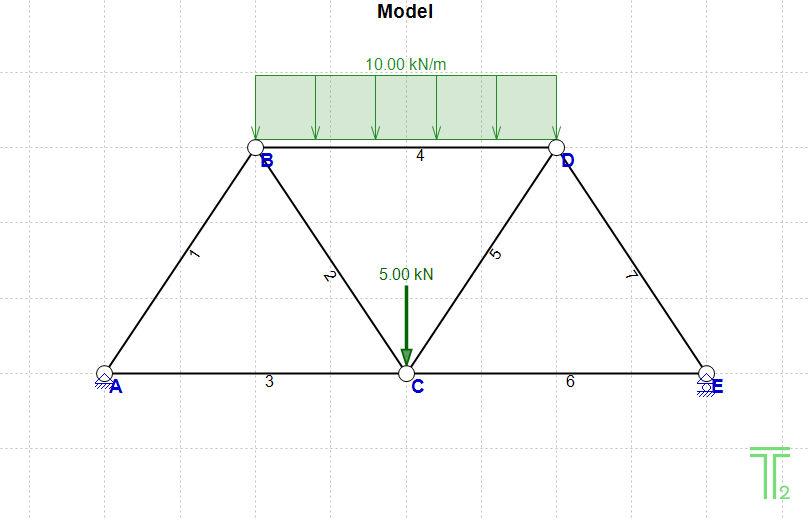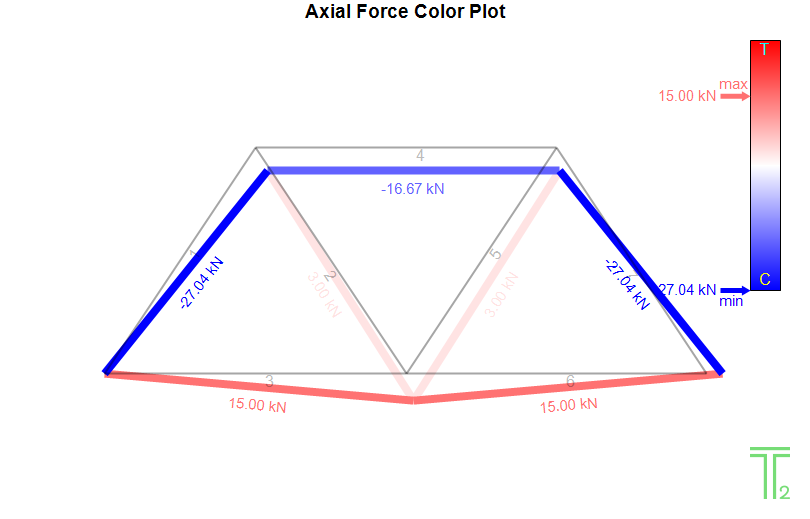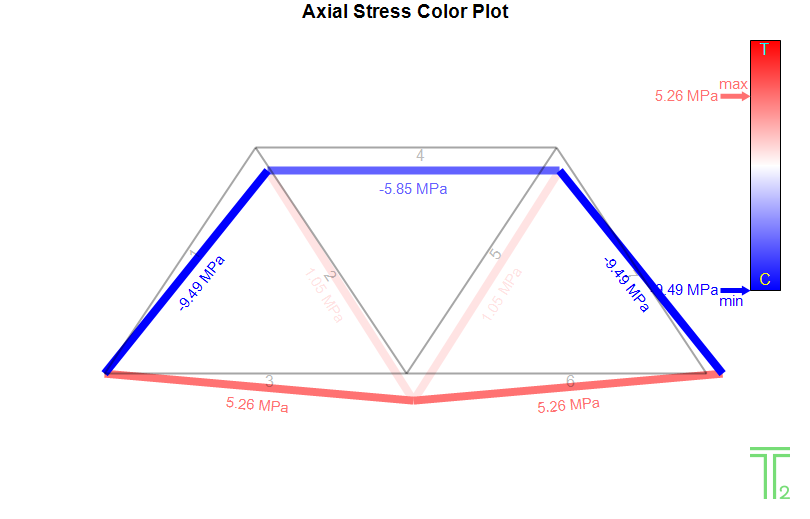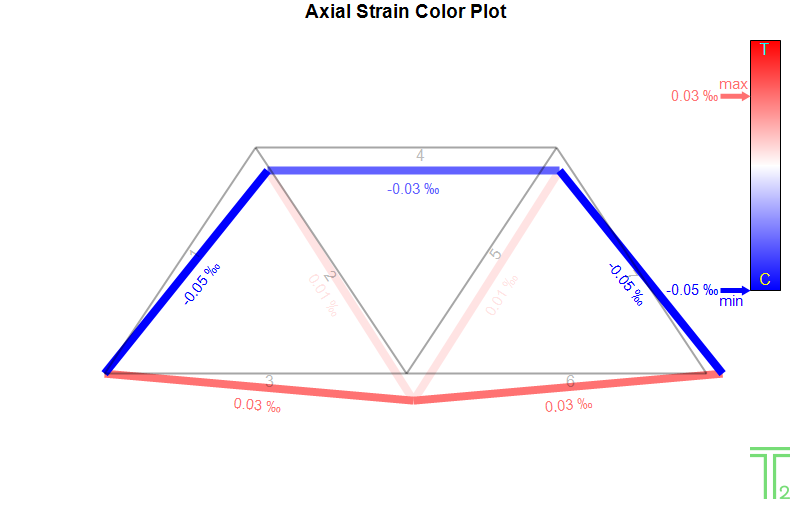
After setting up the Model and analyzing it (Clicking the 'Analyze' button ![]() ) you can click
) you can click ![]() to see the Color Plots.
to see the Color Plots.
There are 3 types of these Diagrams:
•Axial Force Color Plot
•Axial Stress Color Plot
•Axial Strain Color Plot
You can select one of the Diagrams by clicking on the Dropdown menu to the left of the ![]() button:
button:

Note: Diagram values are given also on screen, if the mouse pointer hovers over an element. By default, the diagram of a member in tension is in red color and the diagram of a member in compression is in blue color. In Color Plots, each member is colored with a color "proportional" to the value of the Force/Stress/Strain. For this, a color for a zero-force member needs also to be defined. By default, zero-force members are plotted in white color, matching the background color of the Image. These are the default settings for the three colors, but the user can change these colors in Colors (Settings).
See also:
•Axial Diagrams/Color Plots (Settings)


