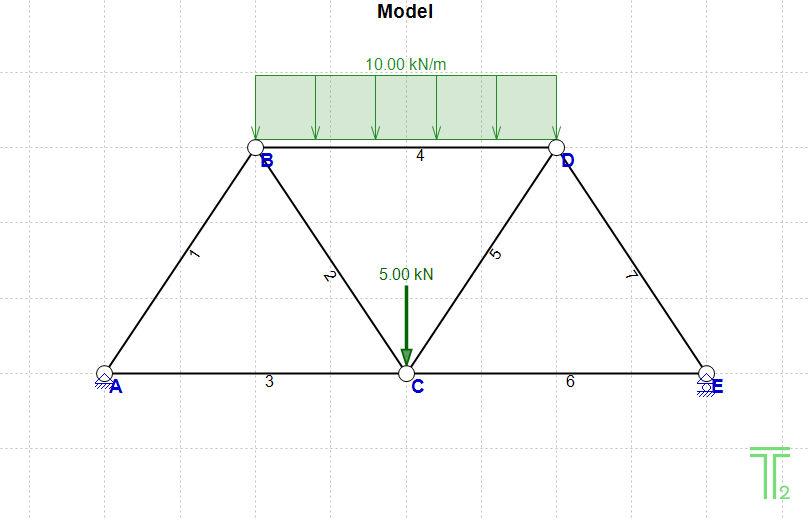
After setting up the Model and analyzing it (Clicking the 'Analyze' button ![]() ) you can click
) you can click ![]() to see the Axial Diagrams.
to see the Axial Diagrams.
There are 3 types of these Diagrams:
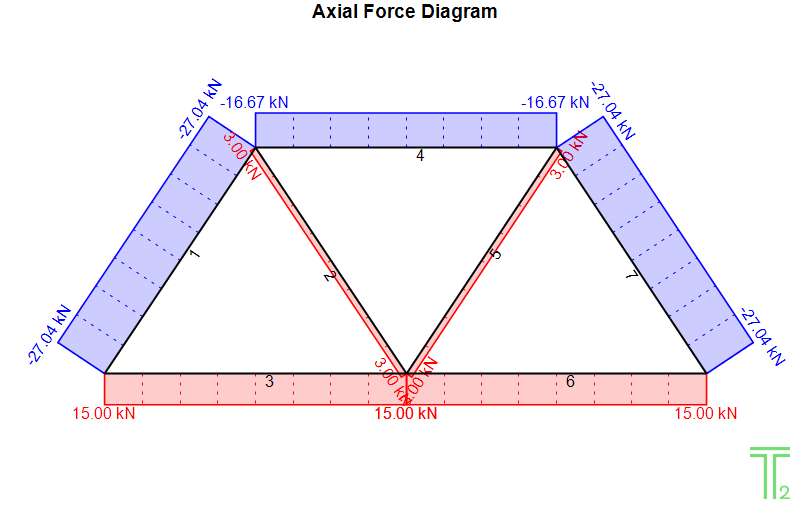
•Axial Force Diagram
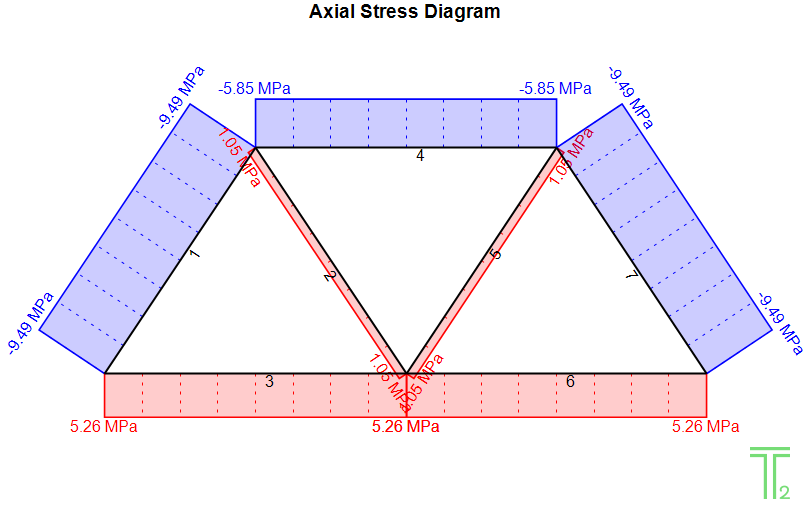
•Axial Stress Diagram
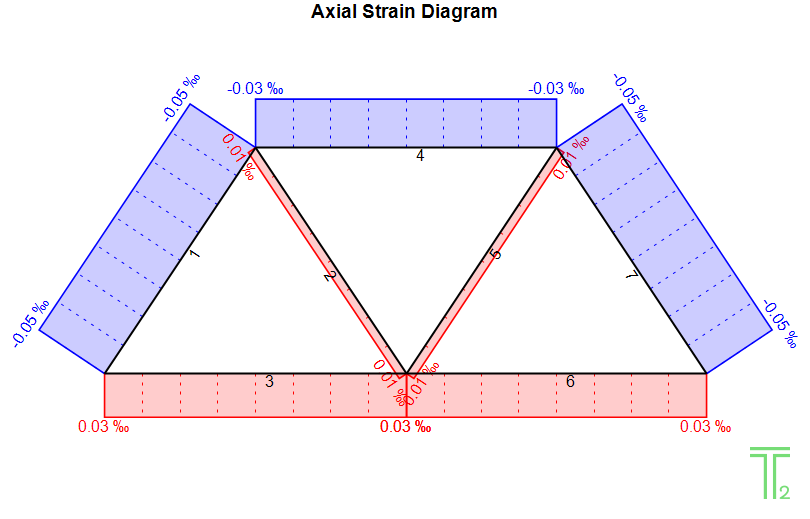
•Axial Strain Diagram
Axial Diagrams depict the values of the Forces, Stresses or Strains in a Diagram, for each Element.
You can select one of the Diagrams by clicking on the Dropdown menu to the left of the ![]() button:
button:

Note: Diagram values are given also on screen, if the mouse pointer hovers over an element. By default, the diagram of a member in tension is in red color and the diagram of a member in compression is in blue color. These are the default settings, but the user can change these colors in Colors (Settings). The tone of red/blue is not changed based on the value of the tensile/compressive force/stress/strain, unlike in Color Plots where the color is "proportional" to the value.
See also:
•Axial Diagrams/Color Plots (Settings)
Example


