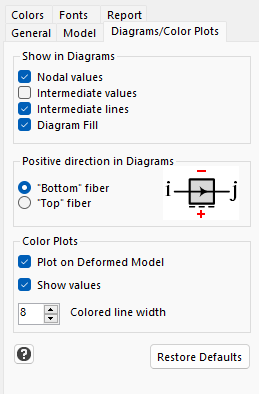
Available settings:
Show in Diagrams
•Nodal values: Shows/Hides the Nodal values of the Axial Diagrams (Force, Stress, Strain).
•Intermediate values: Shows/Hides the intermediate values of the Axial Diagrams.
•Intermediate lines: Shows/Hides the intermediate lines of the Axial Diagrams.
•Diagram Fill: Shows/Hides the Axial Diagrams fill.
Positive direction in Diagrams (applies to all Axial Diagrams)
Determines the positive direction of the diagrams. Applies to all three diagrams (Force, Stress, Strain). There are two options:
|
Positive towards the "Bottom" fiber (Default). Convention usually used in Europe. |
|
Positive towards the "Top" fiber. Convention usually used in the US. |
•Nodal values: Shows/Hides the Nodal values of the Axial Diagrams (Force, Stress, Strain).
•Intermediate values: Shows/Hides the intermediate values of the Axial Diagrams.
Color Plots
•Plot on Deformed Model: The user selects if the Color Plot will be drawn on the Deformed state of the Model or on the original Model.
•Show values: Shows/Hides the Axial Force/Stress/Strain values for every Element in the Color Plot.
•Colored line width: The width (thickness) of the colored line for every Element.
Note:
In EngiLab Truss.2D, the sign convention for the Axial Force (obviously also for Axial Stress and Axial Strain) is the following:
|
Axial Force is Positive when member is in Tension |

